Math for Data Science Jobs: Unveiling the Secret Language of Data

Understanding the theory of math for data science and its importance in making algorithms work is really important. It might not be as easy or exciting as writing code, so many beginners tend to avoid it. But if you want to advance in your data career, you need to be really good at math concepts like calculus, algebra, and statistics.
Some of these math concepts might be harder to grasp than others. How you learn them will depend on what you want to do in the data field and how much you already know. But if you want to create solutions that have a big impact on businesses, you have to understand the math behind your models and algorithms. In this guide, we’ll talk about why math is so important for data science, which topics matter the most, and the best ways to learn it all!

Data science is a powerful field that unlocks the hidden insights within data. But this power comes with a foundation: mathematics. Math serves as the language for data scientists, allowing them to analyze, interpret, and extract knowledge from vast datasets. This blog post dives deep into the essential mathematical concepts you’ll encounter in a data science job, along with practical examples to illuminate their application.
1. Introduction to Math in Data Science
Imagine a company aiming to improve sales forecasts. Data scientists step in, wielding the tools of mathematics. They leverage statistics to unearth trends in historical sales data. Linear algebra empowers them to manipulate data matrices, and calculus helps fine-tune forecasting models for optimal accuracy.
2. Foundational Concepts: Building Blocks of Data Analysis
- Algebra: Algebra isn’t just about solving equations in school! Data scientists use algebraic operations like addition, subtraction, multiplication, and division to crunch numbers. They can calculate average sales, analyze profit margins, or create new metrics by combining existing data points.
- Example: Let’s say a dataset holds monthly sales figures for different product categories. To understand overall sales performance, a data scientist might calculate the total sales per month by adding up individual product sales figures.
- Calculus: This branch of mathematics goes beyond basic calculations. Calculus helps optimize models used for forecasting. Techniques like gradient descent (imagine navigating a steep hill to find the lowest valley) utilize calculus to adjust model parameters and minimize the error between predicted and actual sales.
- Example: In linear regression, a common forecasting method, data scientists use calculus to find the optimal coefficients for the model’s equation. This minimizes the difference between the predicted sales figures and the actual sales data.
- Statistics: Statistics is the heart of data science. It empowers you to analyze trends, identify outliers (unusual data points), and make predictions with confidence. Statistical methods like hypothesis testing can help determine if a marketing campaign genuinely boosted sales or if the observed increase is just a random fluctuation.
- Example: A company runs a social media campaign and wants to know if it impacted website traffic. A data scientist can perform hypothesis testing to analyze website visits before and after the campaign. This helps determine if the increase in traffic can be attributed to the campaign or to other factors.
3. Linear Algebra in Data Science: Shaping and Understanding Data
Datasets often contain numerous variables, making it challenging to visualize or analyze patterns. Enter linear algebra, a branch of mathematics that deals with vectors, matrices, and transformations.
- Linear Algebra Applications:
- Dimensionality Reduction: Techniques like Principal Component Analysis (PCA) use linear algebra to reduce the number of variables in a dataset while preserving the most important information. This allows data scientists to visualize high-dimensional data and identify underlying patterns.
- Example: Imagine a dataset with customer data, including age, income, purchase history, and browsing behavior (many variables). PCA can help reduce this data to a smaller set of key dimensions that capture the most significant variations in customer behavior.
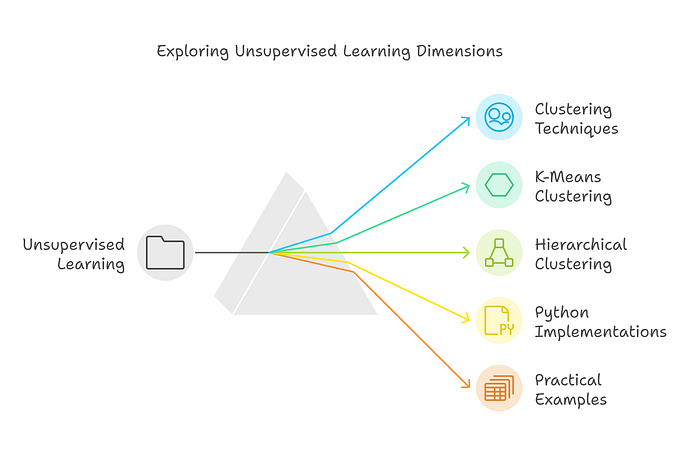
- Clustering: Linear algebra also plays a role in customer segmentation. Techniques like K-means clustering group customers with similar characteristics based on their data points. This helps businesses target marketing campaigns or product recommendations more effectively.
- Example: An online store can use K-means clustering to group customers based on their purchase history. This allows them to target specific product recommendations to different customer segments.
Advanced Linear Algebra Techniques: As you progress in data science, you’ll encounter even more powerful tools within linear algebra:
* **Matrix Decompositions:** Techniques like Singular Value Decomposition (SVD) go beyond PCA. They decompose matrices to reveal hidden patterns and reduce dimensionality for tasks like image compression or feature extraction in image processing.Key Takeaways from Linear Algebra:
- Reduced Complexity: By using techniques like Principal Component Analysis (PCA), data scientists can reduce the number of variables in a dataset while preserving the most important information. This allows for better visualization and identification of underlying patterns in complex data.
- Smarter Segmentation: Linear algebra plays a crucial role in customer segmentation techniques like K-means clustering. This helps businesses group customers with similar characteristics, enabling targeted marketing campaigns and product recommendations.
4. Calculus in Data Science: Optimizing the Journey
Calculus doesn’t stop at minimizing errors in forecasting models. It has broader applications in data science.
- Derivatives: Imagine climbing a hill and constantly adjusting your direction to reach the peak efficiently. Derivatives in calculus work similarly. They help find the steepest slopes in a mathematical landscape, which translates to optimizing models in data science.
- Example: In logistic regression, a classification algorithm, derivatives are used to calculate the impact of changing model parameters on the model’s output. This helps the model learn and improve its accuracy in classifying data points.
- Integrals: Integrals come into play when dealing with continuous data distributions, like probabilities. They help calculate the total area under a curve, which can represent the probability of an event occurring.
- Example: Imagine a dataset showing customer wait times at a call center. We can model wait times using a probability density function. Integrals can be used to calculate the probability of a customer waiting less than 5 minutes, between 5 and 10 minutes, and so on.
5. Probability and Statistics: Unveiling the Likelihoods
Understanding probabilities and statistical relationships is crucial for data science tasks like customer churn prediction.
- Probability: Probability theory helps estimate the likelihood of events occurring. This is essential for tasks like risk assessment, fraud detection, and customer churn prediction.
Conclusion
Mathematics is the foundation of data science. By equipping yourself with these essential mathematical concepts, you’ll be well-positioned to unlock the power of data and make a significant impact in various fields. Remember, the journey of learning math for data science is an ongoing process. Embrace the challenge, and you’ll be well on your way to becoming a data science powerhouse!
Reference Section
- Introduction to Statistical Learning by Gareth James, Daniela Witten, Trevor Hastie, and Robert Tibshirani (https://www.amazon.com/Introduction-Statistical-Learning-Applications-Statistics-ebook/dp/B09BHG37HZ)
- “Mathematics for Machine Learning” Specialization on Coursera: https://www.coursera.org/specializations/machine-learning-introduction
- Towards Data Science: https://towardsdatascience.com/
- Kaggle https://www.kaggle.com/
- https://www.geeksforgeeks.org/maths-for-data-science/