Evaluating and Improving Machine Learning Models: Machine Learning Series for Beginners
Introduction
Welcome to the fifth blog in our Machine Learning Series for Beginners!
So far, we’ve learned how to build models using Supervised Learning and explored patterns in data using Unsupervised Learning. But here’s the reality: Not all models perform well right out of the box.
- How do you know if your model is performing as expected?
- What can you do if your model isn’t good enough?
This blog will answer these questions by walking you through:
- How to evaluate machine learning models effectively.
- Key performance metrics for both classification and regression tasks.
- Validation techniques to ensure your model generalizes well to unseen data.
- Hyperparameter tuning to fine-tune and improve model performance.
As always, I’ll use clear examples, Python code, and beginner-friendly analogies to make this journey simple and enjoyable.
Let’s get started!

Figure 1 provides an overview of the key components involved in Evaluating and Improving Machine Learning Models. It highlights the step-by-step approach starting with the importance of model evaluation, understanding performance metrics for classification and regression, exploring evaluation methods, and learning about validation techniques. Finally, it emphasizes hyperparameter tuning as a fine-tuning step to improve model performance. This figure acts as a roadmap for readers, ensuring they grasp the critical stages of assessing and enhancing machine learning models.
1. Why is Model Evaluation Important?
Explanation: Machine learning models are designed to make predictions, but how do you know if those predictions are accurate? Model evaluation helps you measure the model’s performance using metrics specific to your task.
Analogy: Imagine you’re baking a cake for the first time. To know if the cake turned out well, you:
- Check its taste (accuracy of predictions).
- Ensure it’s not too dry or too soggy (generalization).
- Compare it with other cakes you’ve baked (validation).
Just like baking, evaluating a model ensures you get the “perfect recipe” for predictions.
2. Metrics for Evaluating Machine Learning Models
2.1 Classification Metrics
In classification tasks, the goal is to predict discrete categories (e.g., “spam” or “not spam”). Here’s a breakdown of the key metrics:
Confusion Matrix:
The confusion matrix categorizes predictions into:
- True Positives (TP): Correctly predicted positive cases.
- True Negatives (TN): Correctly predicted negative cases.
- False Positives (FP): Incorrectly predicted as positive (Type I Error).
- False Negatives (FN): Incorrectly predicted as negative (Type II Error).
Let’s visualize this with an example:

Key Metrics:
- Accuracy:
It measures how many predictions are correct overall.
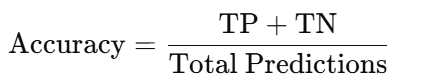
Best For: Balanced datasets (equal positives and negatives).
2. Precision:
Out of all predicted positives, how many were actually positive?
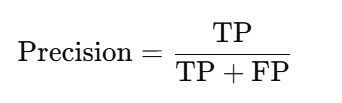
Best For: Tasks where false positives are costly (e.g., spam detection).
3. Recall (Sensitivity):
Out of all actual positives, how many did the model predict correctly?
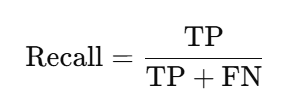
Best For: Tasks where false negatives are costly (e.g., disease detection).
4. F1-Score:
It’s the harmonic mean of precision and recall.
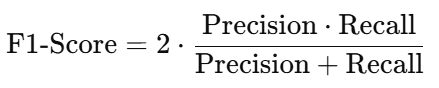
Best For: Imbalanced datasets where both precision and recall matter.
Python Example for Classification Metrics:
from sklearn.metrics import confusion_matrix, accuracy_score, precision_score, recall_score, f1_score

# Example true and predicted labels
y_true = [1, 0, 1, 1, 0, 1, 0, 0, 1, 0]
y_pred = [1, 0, 1, 1, 0, 0, 0, 1, 1, 0]

# Confusion Matrix
cm = confusion_matrix(y_true, y_pred)
print("Confusion Matrix:\n", cm)

# Metrics
accuracy = accuracy_score(y_true, y_pred)
precision = precision_score(y_true, y_pred)
recall = recall_score(y_true, y_pred)
f1 = f1_score(y_true, y_pred)

print(f"Accuracy: {accuracy}")
print(f"Precision: {precision}")
print(f"Recall: {recall}")
print(f"F1-Score: {f1}")
Output:
Confusion Matrix:
 [[4 1]
 [1 4]]
Accuracy: 0.8
Precision: 0.8
Recall: 0.8
F1-Score: 0.8
2.2 Regression Metrics
For regression tasks (predicting continuous values), key metrics include:
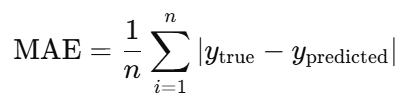
- Mean Absolute Error (MAE): Measures the average absolute difference between actual and predicted values.
2. Mean Squared Error (MSE): Squares the errors to penalize large deviations.

3. Root Mean Squared Error (RMSE): Square root of MSE for interpretable units.
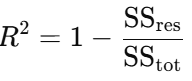
4. R-Squared (R²): Explains the proportion of variance captured by the model.
Python Example for Regression Metrics:
from sklearn.metrics import mean_absolute_error, mean_squared_error, r2_score
import numpy as np

# Example true and predicted values
y_true = [3.5, 2.8, 4.1, 5.0, 6.8]
y_pred = [3.6, 2.7, 4.0, 5.2, 6.5]

# Metrics
mae = mean_absolute_error(y_true, y_pred)
mse = mean_squared_error(y_true, y_pred)
rmse = np.sqrt(mse)
r2 = r2_score(y_true, y_pred)

print(f"MAE: {mae}")
print(f"MSE: {mse}")
print(f"RMSE: {rmse}")
print(f"R-Squared: {r2}")
Output:
MAE: 0.14
MSE: 0.03
RMSE: 0.17
R-Squared: 0.98
3. Model Validation Techniques
Why Validate Models?
To ensure your model performs well on unseen data and generalizes effectively.
3.1 Train-Test Split
Split the dataset into two parts:
- Training Set: Used to train the model.
- Test Set: Used to evaluate performance.
3.2 Cross-Validation
Instead of splitting data once, cross-validation divides the dataset into k-folds:
- Train the model on k−1 folds.
- Test on the remaining fold.
- Repeat for all k folds and average the results.
Python Example:
from sklearn.model_selection import cross_val_score
from sklearn.linear_model import LinearRegression
import numpy as np

# Data
X = np.array([[1], [2], [3], [4], [5]])
y = np.array([1, 2, 3, 4, 5])

# Cross-Validation
model = LinearRegression()
scores = cross_val_score(model, X, y, cv=5)

print("Cross-Validation Scores:", scores)
print("Mean Score:", scores.mean())
4. Hyperparameter Tuning
Hyperparameters are settings for your model (e.g., number of trees in a Random Forest). Tuning these can significantly improve performance.
Grid Search Example:
from sklearn.model_selection import GridSearchCV
from sklearn.ensemble import RandomForestClassifier

# Model and parameters
model = RandomForestClassifier()
param_grid = {'n_estimators': [10, 50, 100], 'max_depth': [None, 10, 20]}

grid_search = GridSearchCV(model, param_grid, cv=3)
grid_search.fit(X, y)

print("Best Parameters:", grid_search.best_params_)
Conclusion
In this blog, we learned:
- Key metrics for evaluating classification and regression models.
- How to validate models using train-test splits and cross-validation.
- The power of hyperparameter tuning to optimize performance.
Model evaluation ensures your model performs reliably on real-world data. In the next blog, we’ll explore Ensemble Learning, where multiple models work together to improve accuracy.