Clustering Algorithms in Machine Learning — Discovering Hidden Patterns
Introduction
Welcome to the eighth blog in our Machine Learning Series for Beginners! 🎉
Let’s imagine a scenario: You walk into a bustling supermarket, and as you stroll through the aisles, you notice how the store is organized — produce in one section, snacks in another, and cleaning supplies in their own corner. What’s fascinating is that no one explicitly tells the store to group similar items together, yet it happens naturally. This is the essence of clustering in machine learning — finding and grouping similar items based on their inherent characteristics.
In this blog, we’ll embark on a journey to uncover the magic of clustering algorithms. Together, we’ll:
- Decode what clustering is and why it’s important.
- Explore popular clustering techniques like K-Means and Hierarchical Clustering.
- Implement these algorithms in Python with fun, real-world examples.
By the end, you’ll see how clustering unlocks hidden patterns in data, from customer behavior to anomaly detection. Let’s dive in! 🚀

Figure 1 provides an overview of Clustering in Machine Learning, emphasizing its importance and components. The diagram highlights the definition of clustering, the K-Means Algorithm for partitioning data into distinct groups, and Hierarchical Clustering, which builds a tree-like structure of clusters. It also showcases real-world examples of clustering, demonstrating how this technique uncovers meaningful groupings in various applications. This visual introduction sets the stage for understanding the role of clustering in unsupervised learning.
1. What is Clustering?
Clustering is an unsupervised learning technique that groups similar data points into clusters. Unlike supervised learning, clustering doesn’t rely on labeled data. Instead, it searches for natural groupings based on patterns, such as shared features or proximity in space.
Storyline: Clustering at a Coffee Shop ☕
Imagine you’re the manager of a popular coffee shop. You observe your customers over a week and notice interesting patterns. Some people prefer lattes, others gravitate toward black coffee, and a few enjoy matcha tea. Based on their preferences, you decide to group your customers into clusters: Latte Lovers, Black Coffee Enthusiasts, and Tea Drinkers.
Similarly, clustering helps machines group data into clusters without any prior labels, revealing insights about behaviors, preferences, or anomalies.
2. Why Clustering Matters
Clustering plays a vital role in:
- Exploratory Data Analysis (EDA): Discovering hidden patterns in datasets.
- Customer Segmentation: Identifying distinct groups for personalized marketing.
- Anomaly Detection: Flagging outliers, like fraudulent transactions.
- Recommendation Systems: Grouping similar users or products to enhance recommendations.
- Image Compression: Reducing image size while retaining key features.
3. Popular Clustering Techniques
A. K-Means Clustering
K-Means is a partitioning algorithm that divides data into K clusters. Each data point belongs to the cluster with the nearest centroid (center of the cluster).
Steps of K-Means Clustering
- Choose K: Decide the number of clusters.
- Initialize Centroids: Randomly select K points as initial centroids.
- Assign Points: Assign each data point to the nearest centroid.
- Recompute Centroids: Update centroids by averaging the points in each cluster.
- Repeat: Iterate until centroids stabilize.
Storyline: A Treasure Map Adventure 🗺️
Imagine a group of treasure hunters divided into K teams. Each team randomly chooses a point to start their search (centroids). Team members explore the area and regroup at their team’s average location. This process continues until each team converges around their treasure (stable centroid).
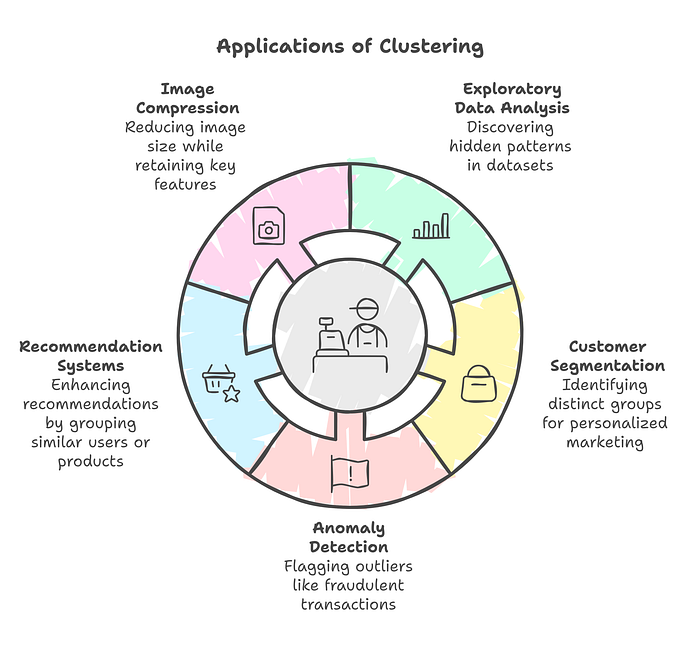
Figure 2 illustrates the Applications of Clustering in various domains, showcasing its versatility and importance. It highlights how clustering is utilized in image compression to reduce size while retaining key features, exploratory data analysis to uncover hidden patterns, and customer segmentation for personalized marketing. The figure also includes applications like recommendation systems to group similar users or products and anomaly detection to flag outliers such as fraudulent transactions. This visual effectively conveys the practical impact of clustering across industries.
Python Example: K-Means with Customer Segmentation
Let’s analyze customer spending habits and group them into segments.
from sklearn.cluster import KMeans
import matplotlib.pyplot as plt
import numpy as np

# Generate synthetic customer data
np.random.seed(42)
X = np.random.rand(200, 2) * 100  # Spending on two categories

# Apply K-Means
kmeans = KMeans(n_clusters=3, random_state=42)
labels = kmeans.fit_predict(X)

# Visualize the clusters
plt.scatter(X[:, 0], X[:, 1], c=labels, cmap='viridis', s=50)
centroids = kmeans.cluster_centers_
plt.scatter(centroids[:, 0], centroids[:, 1], c='red', marker='X', s=200, label='Centroids')
plt.title('Customer Segmentation using K-Means')
plt.xlabel('Spending on Category A')
plt.ylabel('Spending on Category B')
plt.legend()
plt.show()
Output: A scatter plot showing customers grouped into 3 clusters with centroids.
B. Hierarchical Clustering
Hierarchical Clustering builds a tree-like structure (dendrogram) to represent data groupings. It comes in two flavors:
- Agglomerative Clustering (Bottom-Up): Each point starts as its own cluster, and clusters are merged iteratively.
- Divisive Clustering (Top-Down): All points start in one cluster, which is split recursively.
Storyline: Building a Family Tree 🌳
Think of hierarchical clustering as building a family tree. At the start, every family member (data point) is independent. Over time, you group siblings, cousins, and larger family branches, forming a hierarchical structure.
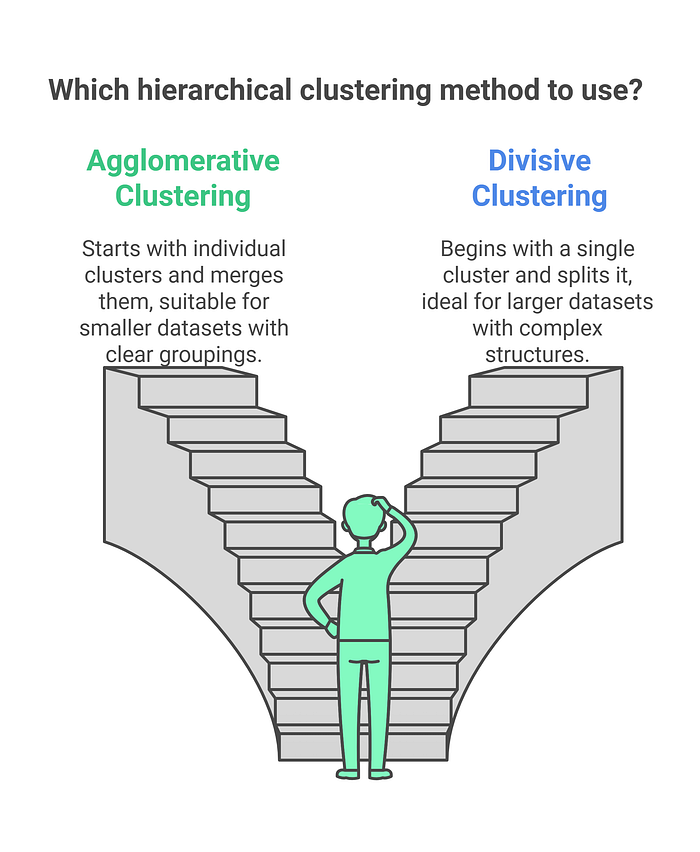
Figure 3 compares two popular hierarchical clustering methods: Agglomerative Clustering and Divisive Clustering. Agglomerative Clustering begins with each data point as its own cluster, merging them iteratively to form larger clusters, making it suitable for smaller datasets with clear groupings. On the other hand, Divisive Clustering starts with all data points in a single cluster and recursively splits them, making it ideal for larger datasets with complex structures. This visual guides readers in choosing the appropriate method for their clustering needs.
Python Example: Hierarchical Clustering with Dendrogram
from scipy.cluster.hierarchy import dendrogram, linkage
import matplotlib.pyplot as plt
import numpy as np

# Generate synthetic data
np.random.seed(42)
X = np.random.rand(50, 2) * 100

# Compute linkage matrix
linked = linkage(X, method='ward')

# Plot dendrogram
plt.figure(figsize=(10, 7))
dendrogram(linked, truncate_mode='lastp', p=10, show_leaf_counts=True)
plt.title('Dendrogram for Hierarchical Clustering')
plt.xlabel('Data Points')
plt.ylabel('Distance')
plt.show()
Output: A dendrogram showing how data points merge into clusters.
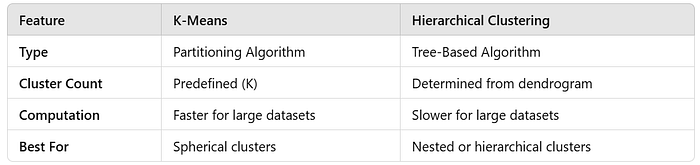
4. K-Means vs. Hierarchical Clustering
5. Real-World Applications of Clustering
- Retail and E-Commerce: Segment customers for personalized recommendations.
- Finance: Detect fraudulent transactions or outliers.
- Healthcare: Group patients based on symptoms or treatment responses.
- Social Networks: Identify communities or groups of users.
- Biology: Cluster genes with similar expressions.
6. Key Takeaways
- Clustering is a powerful unsupervised learning technique for grouping similar data points.
- K-Means is efficient and widely used for partitioning data.
- Hierarchical Clustering builds a dendrogram to visualize cluster hierarchies.
- Choosing the right clustering algorithm depends on dataset size, structure, and the purpose of the analysis.
Conclusion
In this blog, we explored the magic of clustering algorithms, including K-Means and Hierarchical Clustering, with practical examples and relatable analogies. These tools help uncover hidden patterns and organize complex data into meaningful groups.
What’s Next?
Stay tuned for our next blog, where we’ll dive into Recommendation Systems — a game-changing application of machine learning in the digital era.